2024-04-15
Capillaries: analyze how Fannie Mae transfers credit risk from taxpayers to investors - mortgage by mortgage, payment by payment
Background
Since 2013, following the "Big Short," Fannie Mae has been issuing mortgage-backed bonds as part of its "Connecticut Avenue Securities" (CAS) program. This typically occurs several times a year in the form of so-called "deals." For each deal, Fannie Mae selects a pool of qualified mortgage loans and issues bonds that enable investors to receive a portion of the interest payments from the mortgages in that pool. In return, investors are exposed to the risks associated with those mortgages.
For each deal, Fannie Mae publishes data about the mortgage pool. The data comes in the form of a press release like this one and as a dataset that can be downloaded for free from this website. The full directory of all deals is available here.
Every month, the datasets are updated with payment information for each mortgage. Each row in the dataset is a record of the scheduled payment for a specific mortgage. Here is a sample fragment of a dataset for the 2019 R04 G2 deal, downloaded in January 2024, with payment information updated on December 20th, 2023, and the scheduled payment date is October 20th, 2023 (the latest reported payment as of December 20, 2023 - there is a time lag in reporting).
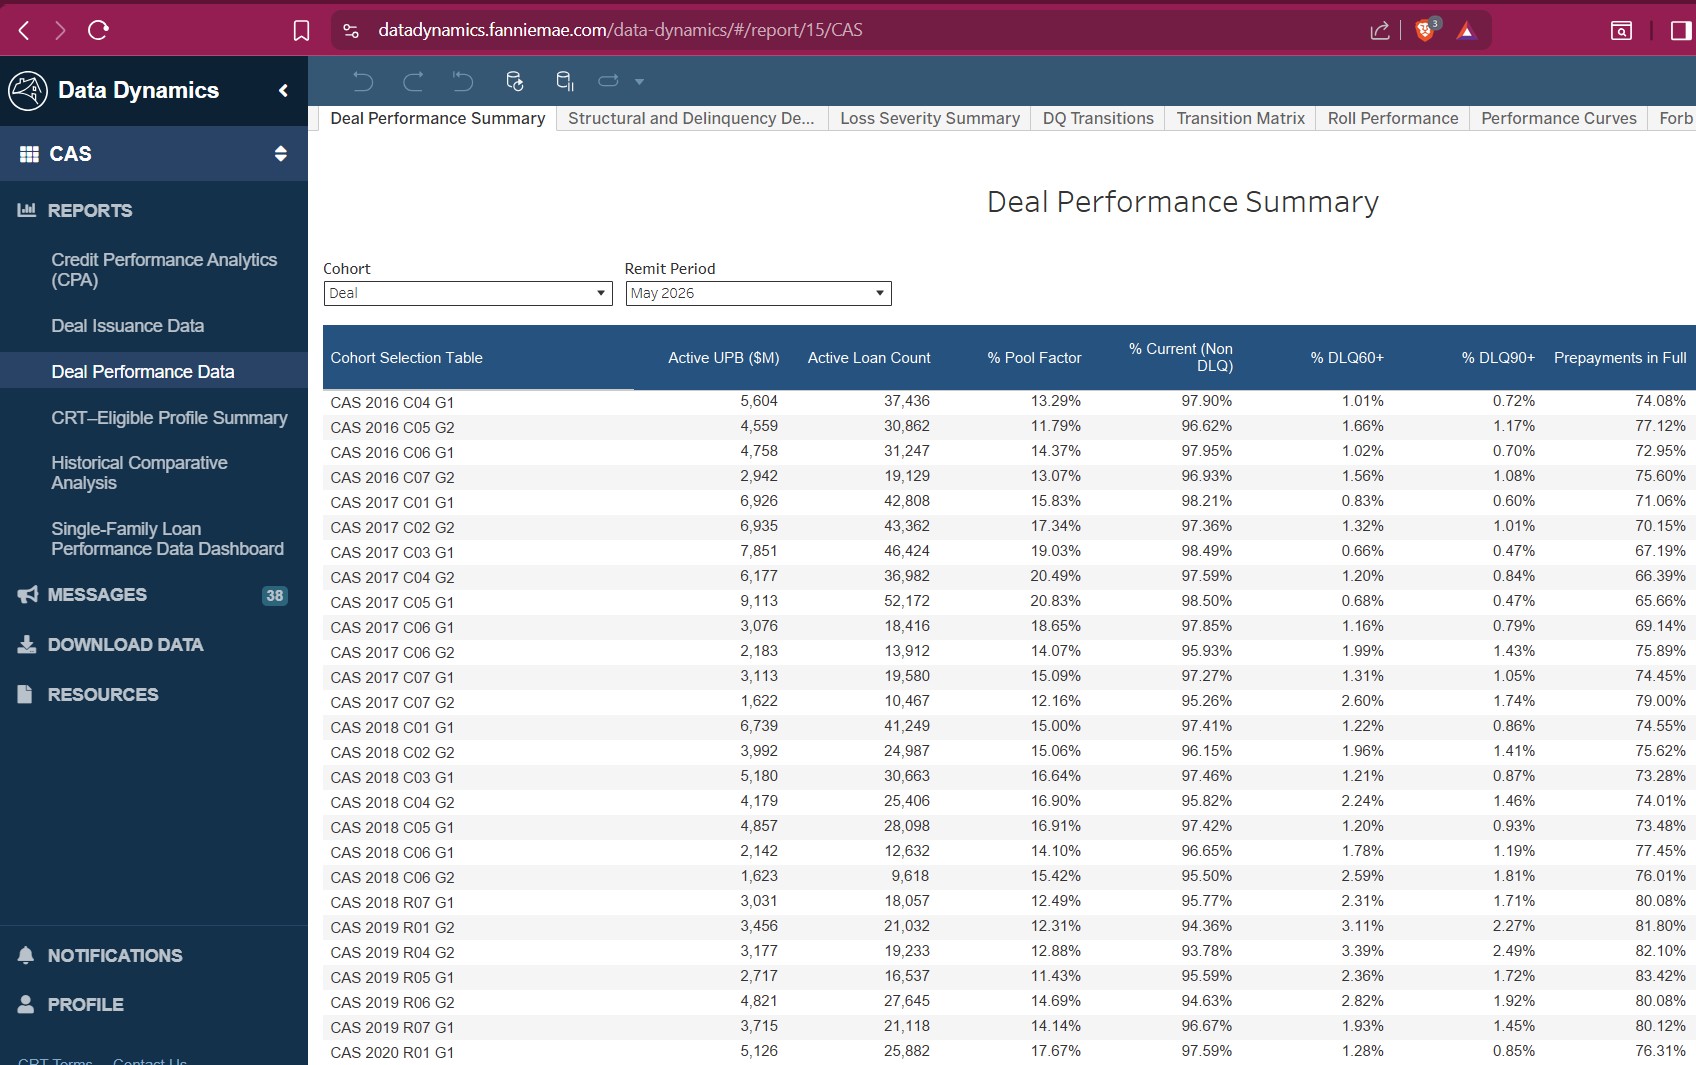
Fannie Mae's Data Dynamics application provides monthly updates on CAS deal performance. But what if an investor wants to take a closer look at underlying mortgage performance?

Capillaries provides an integration test called fannie_mae that processes Fannie Mae datasets for 2022 (24,071,388 payment records) and 2023 (5,102,932 payment records) deals, focusing on payment accuracy for mortgages sold by different sellers. Data processing diagrams:
The full transcript of what the result of each script node looks like in Cassandra is here.
This test gives a realistic estimate of the time and money an organization may need to allocate to analyze this amount of Fannie Mae data.
Numbers and charts
The following tables and charts tell the story of the AWS-based test environment running the fannie_mae script against the 2022-2023 datasets mentioned above, presented as 287 Parquet files, totaling 459MB, with approximately 25 million payment records.
The charts show Prometheus statistics for the AWS environments. The top graph displays CPU usage, the middle one shows Cassandra writes, and the bottom one illustrates Cassandra reads. Open the graph in a separate browser tab to enlarge them.
4 x c7g.16xlarge Cassandra cluster (256 cores)
| Flavor | Cores | RAM | Hourly USD | Qty | Hourly rate x qty | Total cores | Total RAM | |
|---|---|---|---|---|---|---|---|---|
| Prometheus | c7g.medium | 1 | 2 | 0.0363 | 1 | $0.0363 | 1 | 2 |
| RabbitMQ | c7g.medium | 1 | 2 | 0.0363 | 1 | $0.0363 | 1 | 2 |
| Bastion | c7g.large | 2 | 4 | 0.0725 | 1 | $0.0725 | 2 | 4 |
| Cassandra | c7g.16xlarge | 64 | 128 | 2.903 | 4 | $11.6120 | 256 | 512 |
| Daemon (24 workers, 16 writers) |
c7g.4xlarge | 16 | 32 | 0.58 | 4 | $2.32 | 64 | 128 |
| Total | 11 | $14.0771 | 324 | 648 |
| Run times (sec) | 1380 |
| Avg run time (sec) | 1380 |
| Avg cost of run | $5.3962 |
| Cost of setup (10 min) | $2.3462 |

There are a few distinct areas on the graph.
ETL: loading approximately 25 million payment records
This shows an initial (uneven) CPU plateau matching the elevated areas in writes (peaking at around 450k w/s) and reads (peaking at around 220k r/s).
Distinct and join: searching for distinct deals and sellers and combining payment records into one-row-per-mortgage summaries
30% CPU usage, very few writes, ~75k reads/s.
Python formulas: calculating payment accuracy statistics for each mortgage
Daemon instances are at 100% CPU, running Python code for around 1.65 million JSON strings (total number of loans in 2022-2023 deals). Database activity is almost zero.
Producing summaries
Daemons show a flat 20% CPU usage, with minimal activity on the database. Joins on deals and sellers reveal that many batches end up doing nothing due to the data skew issue discussed in a previous post.
Results
The process produces 3 Parquet files:
- loan_summaries_calculated.parquet: 295MB, 1,650,347 rows (one row per each loan participating in CAS programs in 2022-2023)
- deal_summaries: 17 rows, one row per deal, Parquet file
- deal_seller_summaries: 450 rows, one row per deal-seller pair, Parquet file
Just for the sake of the demo, let's show someting that Fannie Mae reports will not tell you - the percentage of missing payments per deal per seller. A simple Excel pivot table using data from deal_seller_summaries.parquet shows this:

Is it possible to tell that some sellers tend to sell mortgages to less responsible borrowers? From this dataset - hardly, but running this calculation for older mortgages may reveal something. Just a reminder: this test dataset was downloaded from the Fannie Mae website in January 2024. The monthly reporting period range for mortgages in these 2022-2023 deals is November 2021 to October 2023. This means the longest payment sequence on hand is only 24 months.
Can we tell a difference between G1 and G2 deals? We probably can: G2 mortgages tend to have a slightly higher rate of missing payments.