2024-08-10
Capillaries: scale up vs scale out
It's all about cost and scalability
This blog post continues the scalability discussion started earlier. There are a couple of technical changes this time:
- Cassandra nodes use local NVME drives for storage (RAM drives were used in past experiments)
- Daemon instances are now x4 less powerful than Cassandra nodes (previously, they were 2x less powerful)
- Graviton-based instances are used (previously, AMD instances were used)
Deployments and pricing
14 Capillaries deployments were tested. Each deployment consists of:
- 4/8/16/32 Cassandra nodes
- 4/8/16/32 Capillaries Daemon instances
- one RabbitMQ server
- one Prometheus server
- one Bastion host (running Capillaries UI and Webapi)

| Deployment flavor | AWS instance | 4 Cassandra nodes | 8 Cassandra nodes | 16 Cassandra nodes | 32 Cassandra nodes | Cassandra | Daemon | Rabbitmq | Prometheus | Bastion | Total cores | Hourly cost | Total cores | Hourly cost | Total cores | Hourly cost | Total cores | Hourly cost |
|---|---|---|---|---|---|---|---|---|---|---|---|---|---|
| aws.arm64.c7g.8 | c7gd.2xlarge | c7g.large | c7g.medium | c7g.medium | c7g.large | 43 | $1.8491 | 83 | $3.5899 | 163 | $7.0715 | 323 | $14.0347 |
| aws.arm64.c7g.16 | c7gd.4xlarge | c7g.xlarge | c7g.medium | c7g.medium | c7g.large | 83 | $3.5895 | 163 | $7.0707 | 323 | $14.0331 | 643 | $27.9579 |
| aws.arm64.c7g.32 | c7gd.8xlarge | c7g.2xlarge | c7g.medium | c7g.medium | c7g.large | 163 | $7.0703 | 323 | $14.0323 | 643 | $27.9563 | ||
| aws.arm64.c7g.64 | c7gd.16xlarge | c7g.4xlarge | c7g.medium | c7g.medium | c7g.large | 323 | $14.0327 | 643 | $27.9571 | 1283 | $55.8059 |
portfolio_bigtest runs
These are the timings for the full run of the portfolio_bigtest in different test deployments. For those who missed previous blog posts, this test calculates detailed yearly performance for 996 stock portfolios using 14,683,696 transactions and 713,800 end-of-month holding records.
| Deployment | Cores per Cassandra node | Cassandra nodes | Run time, s | Cost of run, $ |
|---|---|---|---|---|
| aws.arm64.c7g.8 | 8 | 4 | 1408 | $0.72 |
| 8 | 776 | $0.77 | ||
| 16 | 469 | $0.92 | ||
| 32 | 301 | $1.17 | ||
| aws.arm64.c7g.16 | 16 | 4 | 634 | $0.63 |
| 8 | 344 | $0.68 | ||
| 16 | 263 | $1.03 | ||
| 32 | 214 | $1.66 | ||
| aws.arm64.c7g.32 | 32 | 4 | 336 | $0.66 |
| 8 | 231 | $0.90 | ||
| 16 | 179 | $1.39 | ||
| aws.arm64.c7g.64 | 64 | 4 | 236 | $0.92 |
| 8 | 147 | $1.14 | ||
| 16 | 115 | $1.78 |
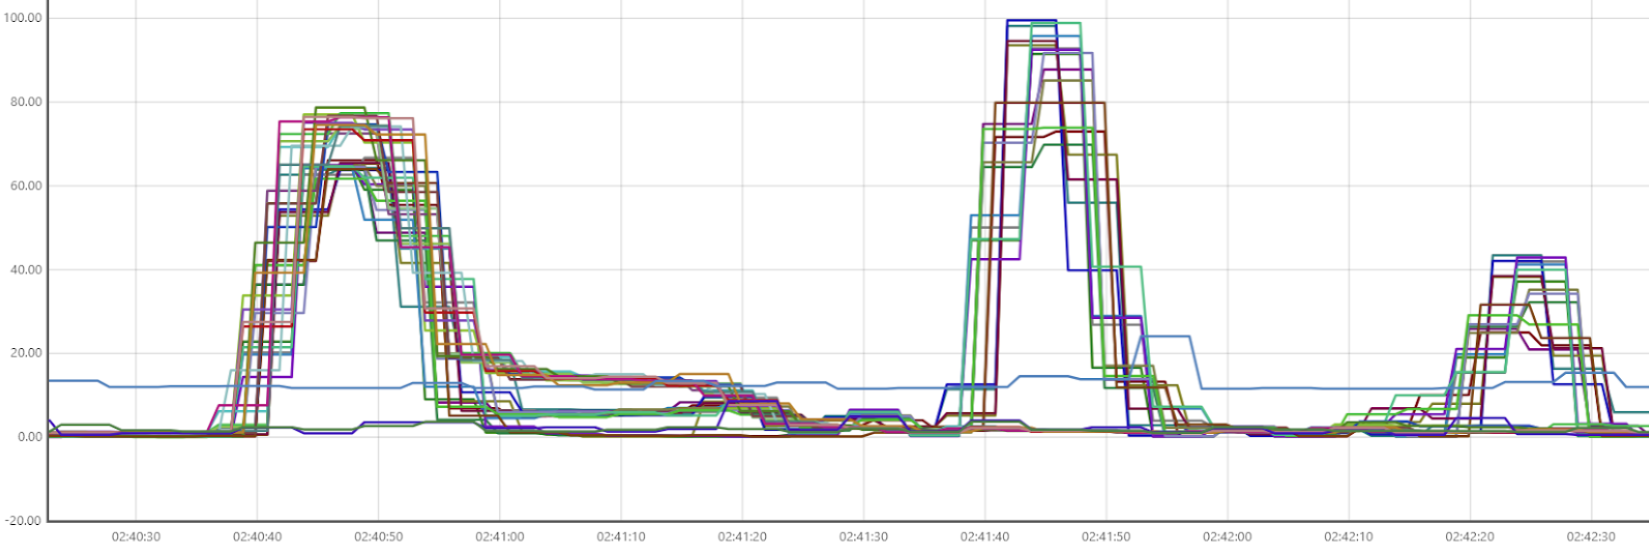
Below is the CPU usage diagram for the 16-node aws.arm64.c7g.64 run. The previous blog post discusses the CPU usage patterns of portfolio_bigtest in detail. It is worth noting that during this run, Cassandra writes peaked at around 2.3 million writes per second.
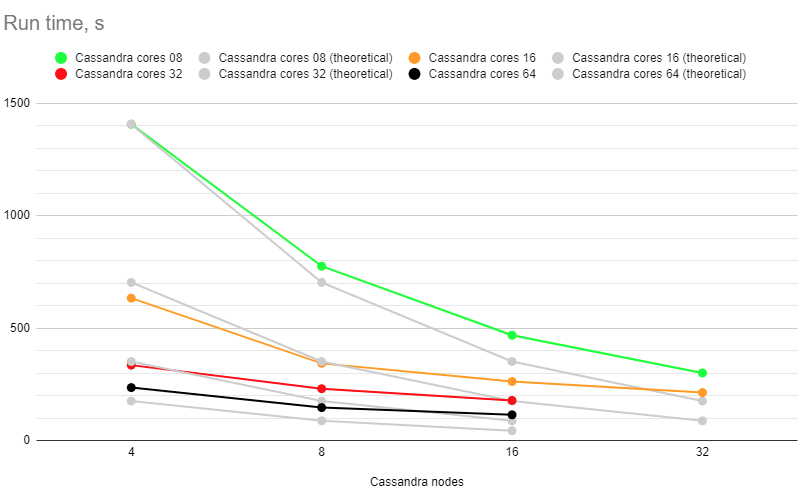
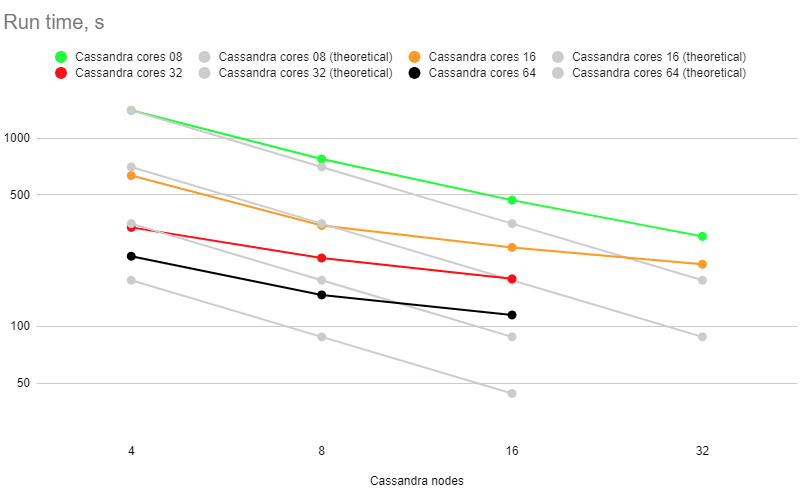
Run times
After creating a pivot table from the raw timing series, we get this summary. "Theoretical" measurements are the values that we would expect for an perfectly scalable (up and out) setup, using the "4 nodes" x "8 cores" 1408 seconds measurement as a starting point.
| Cassandra nodes | Cores per Cassandra node | 8 (actual) | 8 (theoretical) | 16 (actual) | 16 (theoretical) | 32 (actual) | 32 (theoretical) | 64 (actual) | 64 (theoretical) |
|---|---|---|---|---|---|---|---|---|
| 4 | 1408 | 1408 | 634 | 704 | 336 | 352 | 236 | 176 |
| 8 | 776 | 704 | 344 | 352 | 231 | 176 | 147 | 88 |
| 16 | 469 | 352 | 263 | 176 | 179 | 88 | 115 | 44 |
| 32 | 301 | 176 | 214 | 88 |
Cost of run
The pivot table for the cost of each run:
| Cassandra nodes | Cores per Cassandra node | 8 (actual) | 8 (theoretical) | 16 (actual) | 16 (theoretical) | 32 (actual) | 32 (theoretical) | 64 (actual) | 64 (theoretical) |
|---|---|---|---|---|---|---|---|---|
| 4 | $0.72 | $0.72 | $0.63 | $0.70 | $0.66 | $0.69 | $0.92 | $0.69 |
| 8 | $0.77 | $0.70 | $0.68 | $0.69 | $0.90 | $0.69 | $1.14 | $0.68 |
| 16 | $0.92 | $0.69 | $1.03 | $0.69 | $1.39 | $0.68 | $1.78 | $0.68 |
| 32 | $1.17 | $0.69 | $1.66 | $0.68 |
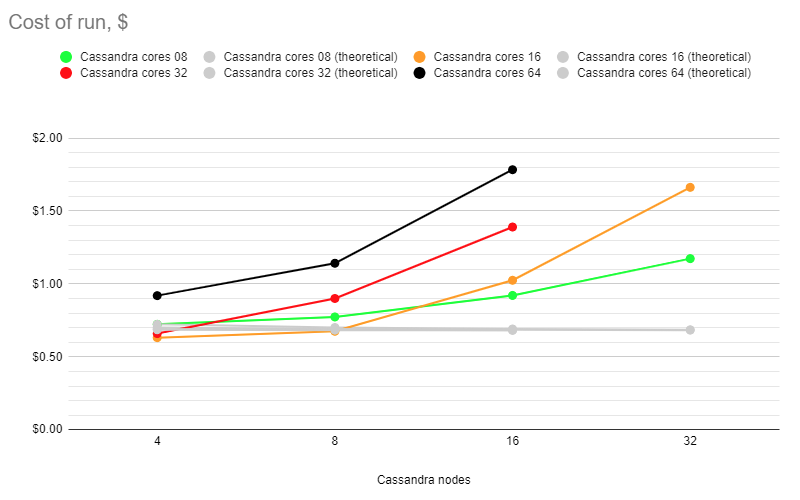
Findings
Scale-up attempts yield decent results for the 4-node setup (surprisingly good for the 8->16->32 core upgrade, but not as good for 64 cores) and for the 8-node setup (surprisingly good for the 8->16 core upgrade, but not as good for 32 and 64 cores). Starting from 8-node setups, using more powerful 32 and 64-core boxes becomes an expensive venture.
Scaling out works reasonably well for 8-core setups: see the green curve. For 16, 32, and 64-core setups, adding more Cassandra nodes makes runs visibly more expensive.
In both cases, the customer has to pay extra for shorter SLA time limits - the red/black cost curves are higher than the "basic" green one, and all curves tend to go up on the right end.