2023-02-20
First look at Capillaries UI
UI snapshots
Below are two scraped snapshots of Capillaries UI that give the idea about the state of the test environment. Click any of the screenshots below and navigate through status screens - all blue elements are clickable, buttons are disabled (button tooltips are working though).
Second snapshot also contains status information about other integration test runs: lookup_quicktest (smaller number of orders and order items), py_calc_quicktest (performs Python formula calculations) and tag_and_denormalize_quicktest (tags data records using regular expressions and calculates tag totals).
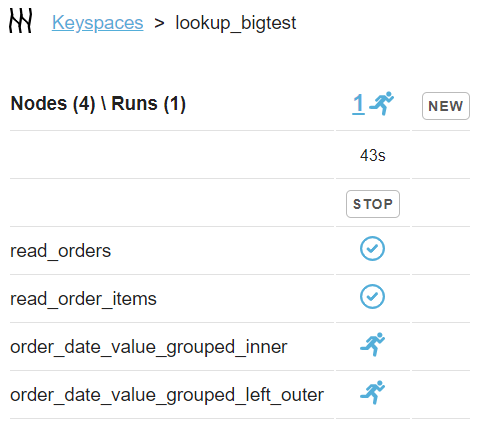
For both snapshots, the navigation starts at the very top "Keyspaces" level.
lookup_bigtest run in progress:
lookup_bigtest (and all other test runs) complete:

What does lookup_bigtest do, anyways?
lookup_bigtest is an integration test, it creates test data (~50K orders with ~100K order items) and runs Capillaries script that:
- reads orders from 10 files and order items from 100 files in parallel
- performs four types of joins in parallel
- saves sorted results as parquet files
This diagram shows the workflow executed by lookup_bigtest:

The diagram was generated by this Capillaries command:
          cd pkg/exe/toolbelt
          go run capitoolbelt.go validate_script \
            -script_file=../../../test/data/cfg/lookup/script_big.json \
            -params_file=../../../test/data/cfg/lookup/script_params_big_fs_one.json